

To cater for a passenger, you have to understand the passenger
- Like
- Digg
- Del
- Tumblr
- VKontakte
- Buffer
- Love This
- Odnoklassniki
- Meneame
- Blogger
- Amazon
- Yahoo Mail
- Gmail
- AOL
- Newsvine
- HackerNews
- Evernote
- MySpace
- Mail.ru
- Viadeo
- Line
- Comments
- Yummly
- SMS
- Viber
- Telegram
- Subscribe
- Skype
- Facebook Messenger
- Kakao
- LiveJournal
- Yammer
- Edgar
- Fintel
- Mix
- Instapaper
- Copy Link
Posted: 23 July 2020 | Carlos Eduardo Gomes Souza - Brazilian Ministry of Infrastructure | No comments yet
Carlos Eduardo Gomes Souza, Airport Performance Coordinator at Brazil’s Ministry of Infrastructure, explains the process behind the Brazilian passenger satisfaction survey and the beneficial results that it created for the country’s airports.
A phrase often said in Brazil during 2007 was “imagine, during the World Cup…” when the country was chosen to host the 2014 FIFA World Cup.
The ironic phrase expressed the incredulity of the population regarding Brazil’s ability to host large mass events. This is due to the limitations of the country’s infrastructure, including stadiums, hotel offers, urban mobility and logistics.
Such fear felt by most Brazilians was not unfounded. In 2006, a serious crisis in the air transport sector – which occurred due to several factors, such as strikes by air traffic controllers and meteorological problems – exposed the weakness of the country’s air transport, reflected largely in the lack of physical capacity in Brazil’s main airports. This episode, known as ‘aerial chaos’, was deeply marked in the memory of the population, with passengers facing flight delays, crowded airports and insecurity as to whether or not they could reach their destinations.
With all this adverse context, the Brazilian government decided that one of its priorities would be the organisation of the air sector. The government committed itself to counter all negative prognoses regarding the quality and efficiency of Brazilian air transport, during what would be the biggest test of one of the most expensive and complex infrastructures in the country’s transport sector.
Investments were required
To face the strong growth in air demand, in addition to addressing the physical and structural lag in Brazilian airports, the government turned its efforts towards modernising airport infrastructure. This was supported by a concession regime that transferred the management of its main airports to the private sector; subsequently stimulating competition, improving operational standards and transferring technologies and experiences in airport administration to Brazil. In this context, investments of over $2 billion were made, providing a growth of 125 per cent in the passenger terminals and 87 per cent capacity in these airports.
But, to achieve success, it was necessary, initially, to understand the real situation of Brazilian airports. This led the government to establish, as one of its priority actions, the monitoring of the quality of services provided at the main airports in the country, in order to obtain a planning and monitoring guide for actions aimed at improving the provision of airport services to passengers.
In order to make such monitoring possible, in January 2013, the National Civil Aviation Secretariat (SAC) developed the Passenger Satisfaction and Airport Performance Survey. The survey assesses the traveller’s experience in regard to infrastructure and services, whilst monitoring the performance of several airport processes – such as check in, security screening and baggage claim – at the main airports in Brazil.
Constituting an important reference for the administration of the airports surveyed and encouraging competitiveness between these terminals, the survey also lends itself to guiding the insertion of new procedures that may improve the passenger service. Initially implemented in 15 airports, the survey currently includes 20 terminals, which are responsible for 87 per cent of the passenger movements within Brazil’s aviation sector.
The Passenger Satisfaction and Airport Performance Survey
The survey collects data through face-to-face interviews, carried out in the departure and arrival halls of the 20 main Brazilian airports, including both domestic and international passengers. It is composed of 37 key performance indicators (KPIs), which are thematically grouped according to the area directly responsible for the process/service:
- Sixteen KPIs related to airport infrastructure
- Eight KPIs related to retail services
- Six KPIs related to airlines
- Six KPIs related to services provided by public agencies
- One KPI related to airport access.
In addition to the KPIs outlined above, the passenger also assigns a score for their overall satisfaction with the airport that day, making up a total of 38 indicators collected, as demonstrated in Figure 1.
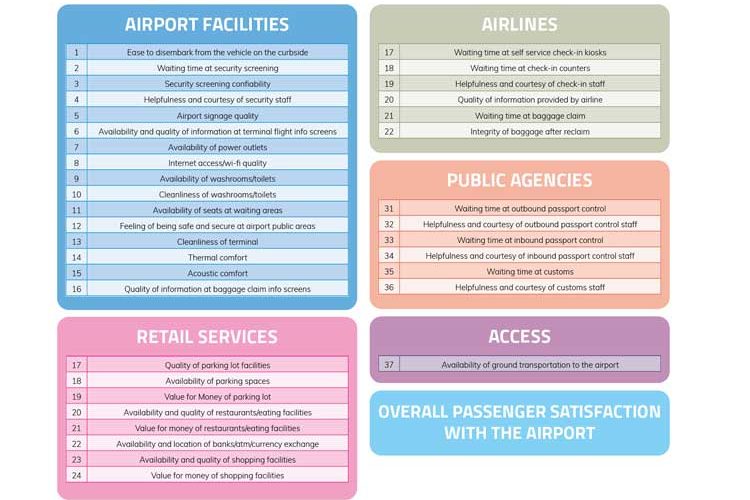
Figure 1 – The 38 indicators of passenger satisfaction.
For each of the KPIs, the interviewee must assign a score that represents their level of satisfaction with the service/process experienced on a five‑point scale. The interviews are applied through portable electronic equipment, using software designed exclusively for the survey.
The interviews are conducted during the peak hours of the surveyed airports, during the 20 busiest days of the month. The results are shared monthly with the airport operators. Every quarter, SAC publishes performance reports on its website, with the results obtained during the previous three months.
Improving passenger experience with survey results
The airport administrations of the surveyed airports now have fundamental information that can be used to directly increase the satisfaction of its passengers”
Over seven years of continuous realisation, it is possible to verify the expressive evolution of passenger satisfaction with the main Brazilian airports. Although it cannot be said that the increase in satisfaction is due exclusively to the survey, it is reasonable to say that it had great relevance in this process – the airport administrations of the surveyed airports now have fundamental information that can be used to directly increase the satisfaction of its passengers.
The increase in passenger satisfaction with Brazilian airports is closely linked to the improvement of the country’s airport infrastructure. From Q1 of 2013 to Q4 of 2019, when the Secretariat released its last quarterly report, passenger satisfaction with Brazilian airports had grown by 16.3 per cent. In the same period, the index of positive airport evaluations, calculated from the percentage of passengers who class the airports as ‘good’ or ‘very good’, went from 69 per cent to 94 per cent, as shown in Figure 2.
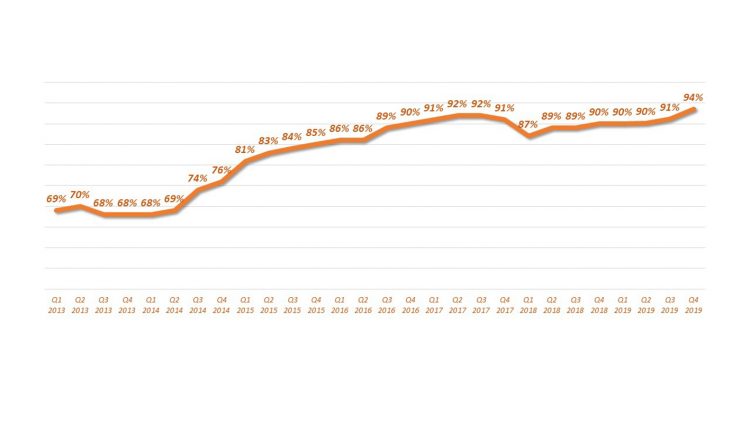
Figure 2 – Passenger satisfaction with Brazilian airports, calculated from the percentage of passengers who class the airports as ‘good’ or ‘very good’.
Among the KPI groupings, airport access was the one that showed the greatest evolution since the beginning of the surveys (26 per cent), followed by the group of retail services to passengers (21.4 per cent), services from public agencies (16.2 per cent), airport infrastructure (12.2 per cent) and airlines (11.8 per cent).
The grouping of retail services to passengers, being composed of indicators that assess the quality of commercial areas and the value for money of products offered inside airports, is historically the one with the lowest average satisfaction. However, it was precisely the indicators related to value for money that obtained the highest percentage of evolution – 34.1 per cent for commercial products and 33.3 per cent for restaurant products – among all those surveyed. This demonstrates that the performance of airport administrations in the commercial areas, diversifying options and increasing competition within the airport environment, has caused a reduction in the price of products offered to travellers.
Concerning the airport infrastructure grouping, the indicators with the lowest evaluations were also those that evolved the most availability of power outlets (29.2 per cent) and quality of Wi-Fi (25.4 per cent). Again, with the survey, it is possible to see that, although these KPIs are still below the ideal grade, the perception of quality with regard to these indicators has evolved over time.
Without the survey, such services would not have reached today’s levels of satisfaction”
Without the survey, such services would not have reached today’s levels of satisfaction. Even if there were investments in these areas, the absence of data to assess the evolution of the perception of quality by passengers would make it impossible to state that the actions taken were efficient.
The monitoring of performance indicators through survey and evaluation contributes to decision making, to the definition of public policies in the civil aviation sector – within the scope of airports – and to securing seamless travel experiences. This includes strategic actions and investments in infrastructure, which, directed to the priorities established for each airport and based on the results of each item evaluated, can result in maximising the efficiency of resources, in addition to increasing passenger satisfaction.
Since its implementation, the survey has been continuously evaluated and improved by the Secretariat, with the participation of public agencies and private sector entities, in addition to airlines and airport operators. A new survey methodology has been applied since January 2020, in a more objective and detailed way, in order to better adapt to the current airport sector in Brazil. Its results are still under evaluation and will be released at the end of Q1 in 2020.
Biography
Carlos Eduardo Gomes Souza is an Airport Performance Coordinator in the National Civil Aviation Secretariat of the Brazilian Ministry of Infrastructure. Working for the Brazilian government for 11 years, Souza has been responsible for the National Passenger Satisfaction Survey in Brazil since 2014. He is also a member of the team responsible for the project to implement end-to-end biometrics in the Brazilian airports and other matters related to air transport facilitation.
Issue
Related topics
Airport construction and design, Baggage handling, Capacity, Passenger experience and seamless travel, Retail, Security, Terminal operations
Related organisations
Brazilian Ministry of Infrastructure, National Civil Aviation Secretariat (SAC)


 Chief Executive Officer
 CEO
CEO Chief Operating Officer
 Head of Operations, Safety and Emergency
 Chief Strategy Development Officer
 Head of Operations
 Airport General Manager
 CEO
CEO Chief Executive Officer