

The 20 busiest international routes in the world
- Like
- Digg
- Del
- Tumblr
- VKontakte
- Buffer
- Love This
- Odnoklassniki
- Meneame
- Blogger
- Amazon
- Yahoo Mail
- Gmail
- AOL
- Newsvine
- HackerNews
- Evernote
- MySpace
- Mail.ru
- Viadeo
- Line
- Comments
- Yummly
- SMS
- Viber
- Telegram
- Subscribe
- Skype
- Facebook Messenger
- Kakao
- LiveJournal
- Yammer
- Edgar
- Fintel
- Mix
- Instapaper
- Copy Link
Posted: 24 May 2018 | George Smith (International Airport Review) | No comments yet
We are often reminded that aviation is a blossoming industry with more and more people taking to the skies every year. But where are they going and what are they doing once they get there?

Commercial airlines shifted 4.3 billion passengers in 2017, a record-breaking year by any counts, and it seems the trend is only going to continue. But where are all these passengers going? Airlines and airports rely on route data to give them an indication over where to pool their resources, but it can often be a daunting task to accrue that data without specialist resources. Luckily there are companies out there who can make sense of a seemingly endless ocean of information to come up with clear answers.
OAG, a leader in flight information, has released its latest report, OAG Busiest Routes, which ranks the world’s busiest international routes for operating flight volume. The results were pulled from aviation data between March 1, 2017 and February 28, 2018. We have recreated the top 20 list below with some details the OAG provided. It should be noted that just because a route saw a large number of flights does not mean it ferried a proportionate number of passengers.
 20: Chicago to Toronto
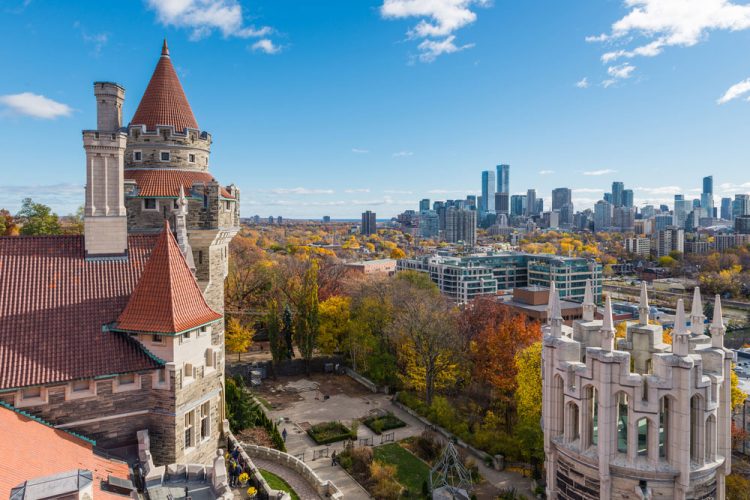 20: Chicago to Toronto
Just over a million passengers flew between these two cities last year. Roughly 60 per cent of the arrivals at each went on to a connecting flight, with San Francisco proving the most popular destination for Chicago arrivals and Edmonton International the most popular for Toronto arrivals.
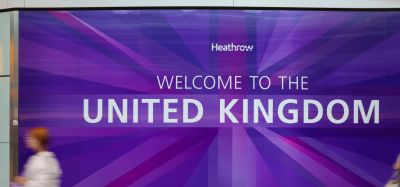
19: Amsterdam to London Heathrow
The second most popular intra-European route last year, 1.8 million passengers flew between the busiest airport in Europe (Heathrow) and the third (Amsterdam) last year. Perhaps unsurprisingly, the bulk of those going on to connecting flights at Heathrow were making their way to American destinations whilst Amsterdam’s connections were far more varied – and included Teesside International.
18: Seoul Incheon – Tokyo Narita
 18: Seoul Incheon – Tokyo Narita
Asian routes unsurprisingly make up 14 of the top 20 busiest. Seventy eight per cent of passengers arriving in Seoul and 81 per cent arriving in Tokyo on this route had reached their destination.
17: Osaka – Shanghai Pudong
Osaka is a regular on this list with three appearances. It’s also one of a surprising number on this list that is not one of the top 50 biggest airports in the world. Others include Dublin, Taipei, New York LaGuardia and Kuwait. The Osaka-Shanghai route has been gaining popularity over the last decade, with almost a million more seats than in 2008.
16: New York John F. Kennedy – London Heathrow
At 5,500 kilometres and a seven hour flight time, this is by far the longest route and only one to fly between continents. British Airways is the most popular carrier of the four main airlines that traverse the intercontinental route, but also the least punctual.
15: Osaka – Taipei
What stands out about this Japan-Taiwan route is the high ‘local share’ of passenger traffic, the highest of any on this list. Ninety four per cent of those arriving at both destinations did not take a connecting flight. It is a popular one for airlines too with 10 carriers competing for the market.
14: Dublin – London Heathrow

It takes just an hour and a half to fly between the Irish capital and London and choice of carrier is limited. Only British Airways and Aer Lingus run the route directly. Choice of aircraft is even more limited. It is alone on this list for having just one aircraft brand: Airbus. It is also notable for the having the second highest number of connecting passengers after Chicago-Toronto.
13: Hong Kong – Beijing
As we draw closer to the top ten we have our first introduction to the airport which features most frequently on this list: Hong Kong. The world’s eighth busiest airport for over all passenger traffic and third biggest for international passengers, Hong Kong is perhaps an unsurprising leader in the field of frequent appearances. This route is one of the few that does not cross any substantial body of water. Taking the train would take around 24 hours, more than 20 hours longer than the flight.
12: Bangkok Suvarnabhumi – Hong Kong
Suvarnabhumi Airport enjoyed a 8.9 per cent growth in passenger numbers last year, and 13 per cent in domestic passengers, though this particular route shrunk by 6 per cent in 2017. It is one of seven routes on this list that is run entirely by mainline carriers.
11: Bangkok Suvarnabhumi – Singapore
Suvarnabhumi’s final appearance and Singapore’s first. The latter pops up four times on this top 20, making it the second most frequent entry after Hong Kong. This route carried 2.9 million passengers in 2017 with 3.6 million seats, coming to a passenger load factor of 79 per cent.
10: Hong Kong – Singapore
Capacity on this route leapt from around 3 million in 2009 to more than around 4.5 million in 2011. Over the last five yeas it has dropped by around on average every year. Last year there were 4.1 million seats available with 3.2 million passengers carried giving it a load factor of 77 per cent. Both of these airports made SkyTrax’s 10 best airports in the world with Hong Kong coming in fourth and Singapore securing the top spot for the sixth consecutive year.
9: Dubai – Kuwait
The only Middle Eastern entry on this list, Dubai to Kuwait has been a big mover. Over the last five years it has grown by a year-on-year average of 6 per cent, but its growth over the last decade is more dramatic, rising from around 2 million seat capacity to 3.7 million. Dubai is the world’s busiest airport for international traffic having overtaken Heathrow in 2014. In 2018 it is expected to grow around 2.4 per cent more to handle 90.3 million passengers. A statistic that leaps out of this entry is the capacity share its largest airline, Emirates, which stands at 49 per cent. This means that of the seats available last year on this line, nearly half were on Emirates flights.
8: New York LaGuardia – Toronto
This is the final route on this list outside of Asia. It is the most popular route out of the United States with 16,956 flights between the two cities over 2017 to the beginning of 2018. In fact, it handled nearly half as many passengers than the JFK-Heathrow line, but with more than 3,000 more flights, it ranks substantially higher in this list. At 88 per cent, it has one of the highest load factors too (that is number of seats versus passengers carried), second only to Amsterdam-Heathrow which has a 90 per cent load factor.
7: Hong Kong – Seoul Incheon
 7: Hong Kong – Seoul Incheon
Returning to Asia, where we will stay for the remainder of this top 20, 17,000 flights traversed the Hong Kong-Seoul line in 2017. One statistic that stands out on this route is the number of airlines that run it. Eleven carriers are competing in the same market place with Cathay Pacific Airways emerging as the biggest with a 26 per cent share of the capacity. It is another route that has enjoyed a boom in capacity over the last decade. In the late 2000s, it offered just less than 2.5 million seats a year. In 2017, it had increased that by nearly 2 million to 4.3 million.
6: Seol Incheon – Osaka
Our last visit to Korea and our last visit to Japan. This route, which takes one hour and 45 minutes, has seen the biggest average annual growth rate over the last five years with 16 per cent. In second place is the route between Shanghai and Osaka with 12 per cent. There were 17,500 flights between Seoul Incheon and Osaka last year and a 33 per cent growth in seat numbers. Nearly 90 per cent of arrivals at both destinations did not go on to take a connecting flight.
5: Jakarta – Kuala Lumpur
Entering our top five and we jump to 18,800 flights every year. There were 3.5 million seats available on this route, with 78 per cent of them filled – or 2.7 million passengers. This is another crowded market for carriers, unsurprising given its popularity, with nine airlines vying for their cut. The largest of these is Malaysian Airlines with a capacity share of 23 per cent, followed by Air Asia then Lion Air. Indonesia Airasia X has the dubious honour of being the second least punctual airline to appear on this list with a 29.3 per cent on-time take off rate. It is seconded only by Orient Thai Airlines, which on the Bangkok-Hong Kong route had a rating of 0 per cent.
4: Hong Kong – Shanghai Pudong
Nearly five million seats were available for this two-and-a-half hour journey last year, with 21,900 flights taking off between the two destinations. This is another entry that does not cross any significant body of water, meaning the journey could be made by land transport – but you wouldn’t necessarily want to. It would take more than 20 hours to get from Shanghai to Hong Kong by train.
3: Jakarta – Singapore
We take the biggest leap of the list to go from the number four spot to the number three. The Jakarta to Singapore route saw 27,300 flights in 2017 – more than 5,000 more than the Hong Kong to Shanghai route. Of 5.6 million available seats, 4.7 million were occupied meaning its passenger load factor reached 83 per cent – the second highest in the top ten. Seat capacity growth was down by 1 per cent last year and the average annual growth rate is a flat 0 per cent.
2: Hong Kong – Taipei
Hong Kong’s final appearance is on a route that has seen a year-on-year average 3 per cent fall in seat capacity over the last five years. That being the case, it’s still the by far the biggest people shifter on this list. There were 8.2 million seats available on this line in 2017 with 6.5 million passengers carried – a load factor of 80 per cent. By comparison, the number two spot in terms of seats is Jakarta to Singapore which offered 32 per cent few seats and flew 28 per cent fewer passengers. The total number of flights on this line came to 28,887.
1: Kuala Lumpur – Singapore
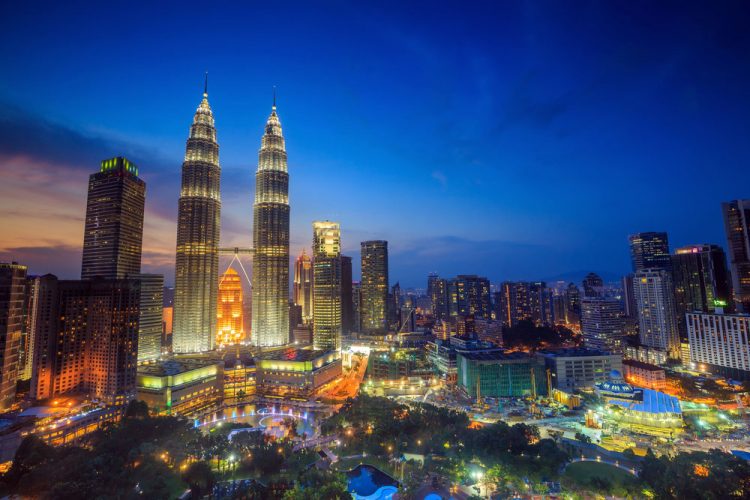
The top spot saw 30,537 flights in 2017. These airports were popular for connecting flights with 37 per cent of arrivals at each jetting off to another destination. From Kuala Lumpur, the most popular of these was Kota Kinabalu International Airport – a domestic flight of two hours and 45 minutes. Australian destinations were the most popular for flyers from Kuala Lumpur connected through Singapore, with Brisbane coming out on top.
The OAG’s report goes into more detail about each route. Click here to see more.
Related topics
Airport development, Economy, Passenger volumes, Route development, Tourism


 Chief Executive Officer
 CEO
CEO Chief Operating Officer
 Head of Operations, Safety and Emergency
 Chief Strategy Development Officer
 Head of Operations
 Airport General Manager
 CEO
CEO Chief Executive Officer