

Creating effective data visualisations to support quick business decisions
- Like
- Digg
- Del
- Tumblr
- VKontakte
- Buffer
- Love This
- Odnoklassniki
- Meneame
- Blogger
- Amazon
- Yahoo Mail
- Gmail
- AOL
- Newsvine
- HackerNews
- Evernote
- MySpace
- Mail.ru
- Viadeo
- Line
- Comments
- Yummly
- SMS
- Viber
- Telegram
- Subscribe
- Skype
- Facebook Messenger
- Kakao
- LiveJournal
- Yammer
- Edgar
- Fintel
- Mix
- Instapaper
- Copy Link
Posted: 15 July 2021 | Zihong Gorman | No comments yet
Zihong Gorman, IT Manager at San Francisco International Airport, details how upgrading their ETL programmes has reinvigorated analytics tools at the airport and is allowing both itself and business users to achieve so much more from their data.

Information Technology (IT) teams face a unique challenge today in how to enable the effective use of their organisations’ data. The increased volume and variety of data has outgrown the technologies of the 1990s and the early 2000s; business demands have outpaced the before-established IT support infrastructure and processes.
Our decade-and-a-half-old data warehousing practice was not meeting the needs of the organisation… It was clearly time for change”
In 2015, feedback from San Francisco International Airport’s (SFO) business users pointed to a glaring deficiency: our decade-and-a-half-old data warehousing practice was not meeting the needs of the organisation. Our report development process was too long. The internal IT team pointed to the poor quality of data and the complex Extract-Transform-Load (ETL) programmes as reasons why development took so long.
It was clearly time for change.
Self-service ETL and dashboarding is the answer
Our business users wanted to be more self-sufficient. Absent of a robust tool, they turned to Microsoft Excel Spreadsheets. As experts in their fields, they know what they are looking for, and Excel gives them the flexibility to trial and error and respond to changing business needs.
What we needed was a product that could retain the flexibility and self-sufficiency of Excel and yet allow secured sharing and centralisation of key data quality standards.
In other words, we needed a tool that allows users to do their own ETL and build their own dashboards.
Product selection: Cutting out noise and sharpening focus
The business intelligence tools market presented many options. It was easy to get lost in the abundance of innovative and attractive features.
We cut out the noise and maintained focus on our end goal: self-service ETL and dashboarding.
We cut out the noise and maintained focus on our end goal: self-service ETL and dashboarding”
When Tableau surfaced as one of the top-ranking options, we put it through a series of vigorous tests: Would non-technical users be able to bring data into the workspace and join it with data from a completely different source without understanding the concepts of “outer join” or “inner join”? Would they be able to run some numbers quickly without knowing the difference between “dimensions” and “measures”? Would they be able to clean up the data as they saw fit by removing bad records and updating dirty ones? Would they be able to create stunning charts by dragging and dropping? Would they be able to download the charts as images to use in a PowerPoint presentation?
We asked the IT team members to take a persona from their customer base and score the products in answers to these questions. Tableau scored the highest.
Democratising service and process innovation
The implementation of a new tool means disruption of existing people skills and processes. With Tableau purchased, installed and ready to go, there were many remaining questions to answer: How should we promote the use of the tool in the business communities? What existing processes must change? What new services need to be established?
Our flexibility generated higher satisfaction and supported the agility of the airport’s business operations”
Traditional IT practices call for standardisation of service products and service processes. Yet, the airport is a complex business entity. With many different lines of businesses come diverse work cultures and business user skillsets. How would we establish standard service intake, assignment and fulfilment, as well as maintain customer satisfaction?
We let the front-line IT team members work with their business counter parts to come back with their answers. We based our service offerings on the specific needs of the business domains and established Service Leve Agreements (SLAs) accordingly.
Our flexibility generated higher satisfaction and supported the agility of the airport’s business operations.
Prototypes as products
Traditional waterfall Software Development Life Cycle (SDLC) is designed to “set-in-stone” business requirements, which drives code-development and automation in the backend. The IT Business Intelligence Development Team was not immune to such mentality. Business stakeholders must commit to a tightly scoped requirements document before development starts, and changes must go through a rigid change management process.
Yet, on the business side, analytics and dashboarding is often a learn-as-you-go process. When they come to IT to have a dashboard developed, their requirements on what to show and how to show it could change overnight as they learn more about their data and their audience and as they sharpen their objectives.
We came to understand that quick prototypes are the products that they need, and our concern over backend automation is misplaced before a series of prototypes allow them to finalise their thinking. We made the development of prototypes a standard step in our process and set SLAs around it.
Business users welcome and appreciate the quick turnaround and flexibility of this new process.
IT as trainer and coach
A standardised Tableau foundation class was set up as a course for employees to sign up for in the airport’s training facility and was offered monthly”
One of the IT developers started out by giving Tableau training to the departments that he served. Over time, it was apparent that there was wide-spread demand for the training. A standardised Tableau foundation class was set up as a course for employees to sign up for in the airport’s training facility and was offered monthly. Furthermore, license keys and access to the development sandboxes were only given out to graduates of the foundation class, to ensure that those who had access could be productive with the tool.
Over time, it was apparent that graduates from the class needed further coaching when they encountered real business scenarios. We began to offer a second advanced class focusing on scenarios submitted by business users and walked them through how each problem could be solved.
To-date, several business users became savvy Tableau developers and have created effective visualisations to support quick business decisions. A strong analytics community is taking shape.
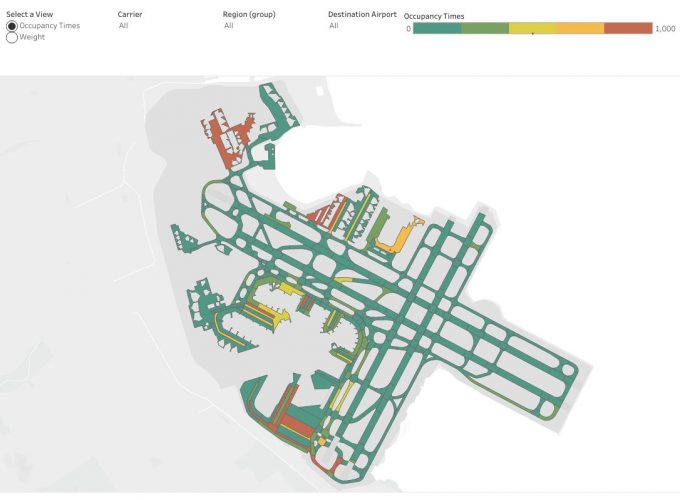
Credit: San Francisco International Airport – Figure 1: A dynamic dashboard showing the taxiway occupancy time.
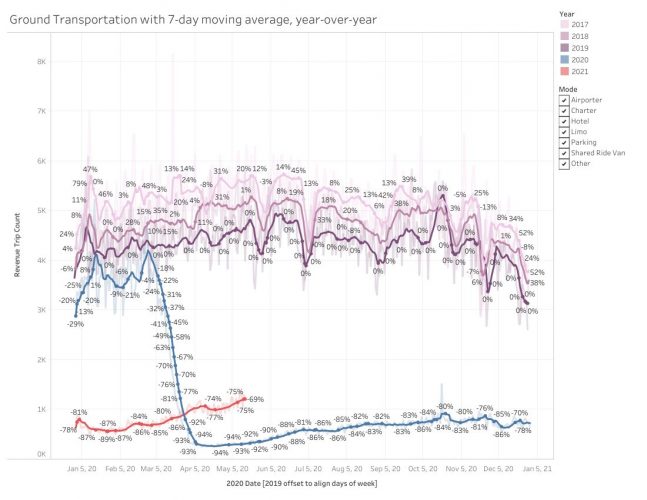
Credit: San Francisco International Airport – Figure 2: A dynamic dashboard showing COVID-19 impact on roadway traffic.
Less coding, faster answers
Our old data warehousing practice treated every job as a coding job, which started with requirements and data analysis, and lead to programme developing, testing and implementation.
With the help of a highly autonomous tool like Tableau, the amount of coding that we needed to do was drastically reduced. Our contribution to the business became our unique mastery of the wide variety of data sources and their intricate internal connection to each other.
The airport saw a five-year rapid growth of passengers from 2016 to 2019 and, during that period, many of our services and facilities reached peak capacity. We received many urgent requests from executives, front-line managers and operators for the quick analysis of data to help them to make critical business decisions to handle the demand.
The IT team became advocates for the business, learned their concerns and business objectives, and produced data analytics to provide answers to their urgent questions”
Once again, there was no time to worry about back-end automation and productisation. What was needed was simply analytic services and a presentation of the results in an easy-to-consume fashion.
The IT team became advocates for the business, learned their concerns and business objectives, and produced data analytics to provide answers to their urgent questions.
When asked about the value of the IT teams, our problem-solving analytics, not the long-lasting slick dynamic dashboards, stand out.
Next steps
Building on the success of self-service ETL and dashboarding, our next step is to further take the IT BI team out of the analytics business by providing business analysts with direct access to the data. To do that, we are implementing a data catalogue product.
Zihong Gorman, who has an MBA in Information Systems, has worked at San Francisco International Airport as an IT manager for 20 years. She has taken on the roles of Data Warehouse Consultant, Manager of Information Access and Manager of Innovation & Design. She is currently the Manager of Information and Data Services in the Information Technology and Telecommunications Division.
Related topics
Airside operations, Big data, Information technology (IT), Terminal operations, Workforce


 Chief Executive Officer
 CEO
CEO Chief Operating Officer
 Head of Operations, Safety and Emergency
 Chief Strategy Development Officer
 Head of Operations
 Airport General Manager
 CEO
CEO Chief Executive Officer