

Improving operational efficiency using sensor technology
- Like
- Digg
- Del
- Tumblr
- VKontakte
- Buffer
- Love This
- Odnoklassniki
- Meneame
- Blogger
- Amazon
- Yahoo Mail
- Gmail
- AOL
- Newsvine
- HackerNews
- Evernote
- MySpace
- Mail.ru
- Viadeo
- Line
- Comments
- Yummly
- SMS
- Viber
- Telegram
- Subscribe
- Skype
- Facebook Messenger
- Kakao
- LiveJournal
- Yammer
- Edgar
- Fintel
- Mix
- Instapaper
- Copy Link
Posted: 27 November 2016 | Esben Kolind (Head of Operational & Business Analysis: Copenhagen Airport) | No comments yet
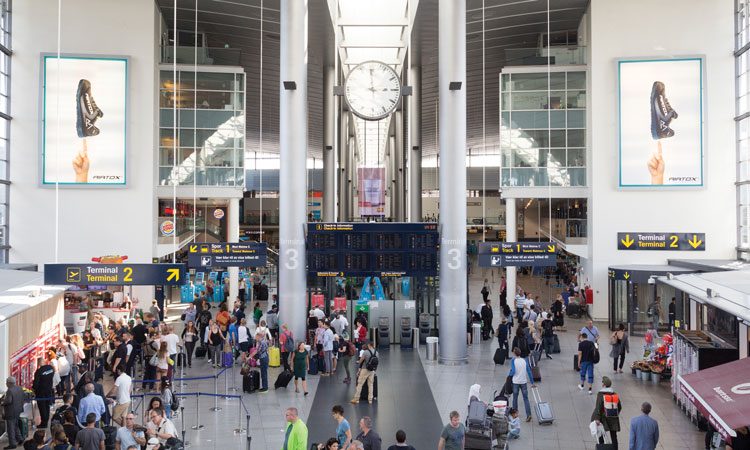
Sensor technologies for passenger flow measurements provide large volumes of data. Esben Kolind, Head of Operational & Business Analysis, details how Copenhagen Airport (CPH) uses data not only to display and report waiting times, but to improve the planning process and increase operational efficiency.
The Operational and Business Analysis (OBA) team at Copenhagen Airport was formed in 2010 with direct report to the COO. The main responsibility of the team is to assist the airport’s four main operational departments (passenger and terminal services, security, baggage and traffic) in optimising their operation through planning, data analysis and data modelling, on a daily basis as well as on a tactical and strategic level. At the time each operational department employed a single analyst. The OBA was created in order to strengthen the analytical and data-driven mind-set in CPH and create synergies between the different areas.
Over the years, the team has worked closely with operational specialists and project managers on a number of passenger flow-related initiatives including self-service bag drops, queue management, e-gates at security and automated border control. In addition, the team has headed the implementation and further development of new operational planning models, follow-up reports, forecasting methods and sensor technologies. The work done in two of these areas – check-in and security – will be described in more detail in this article.
Finally, the team is responsible for calculating the long-term demand for operational infrastructure as input to the overall masterplan ‘Expanding CPH’; designed to bring CPH from its current 26.6 million passengers towards 40 million passengers. In recent years the team has also completed international consultancy projects for other airports based on the knowledge and experience gained from their work in CPH.
The team currently consists of eight members, each with an academic background in operations research and applied mathematics. Daily contact with a broad range of stakeholders inside and outside the organisation provides the insight needed to understand how data can be used (and where it has limitations) as well as the operational aspects and robustness that must be taken into account in any plan, data model or demand forecast to provide a realistic view of the operation – current or future.
Sensor technologies for passenger flow monitoring at CPH
Three sensor technologies for passenger flow monitoring are currently in use in Copenhagen Airport:
- Dedicated Wi-Fi/Bluetooth detection (provided by Passenger Predictability) is used for measuring waiting times in the central security check for all local departing passengers (20 lanes)
- Stereo cameras (provided by Xovis) are mounted in the ceiling in all check-in areas (110 counters) and all border crossings (five areas)
- Close to 1,000 access points (provided by Cisco) provide free Wi-Fi to all passengers in the terminals and gives valuable location data on the overall passenger flows and dwell times in the different areas of the terminals.
The use of data from the first two technologies will be discussed in the following sections.
Establishing a real-time overview of security performance
The central security check is located on the first floor above the check-in areas and has two well-defined entrances to a queuing area separated from other passenger flows. In this layout, Wi-Fi/Bluetooth detection is ideal and provides a simple and efficient measurement of waiting times. Nodes are installed where passengers leave the check-in area; throughout the queuing area; and in each security lane to detect when passengers exit the queue. The high volume of passengers at all times of the day yields penetration rates sufficiently high to enable the calculation of the waiting time metrics. The predicted waiting time for passengers entering the queue is then displayed on dynamic signs in the terminal, on the airport homepage and on the CPH app.
Originally, the sensor system was used solely for reporting purposes, where follow-up reports would be generated in the morning to display yesterday’s performance. However, since 2010 the OBA team has worked closely with the supplier Veovo and the CPH security department to develop a setup where the waiting time data is used for real-time decision making, follow-up, forecasting and planning in conjunction with numerous other data sources.
One such data source is the e-gates at the entrance to security where all boarding cards are scanned. This provides extremely valuable information on passenger show-up and load factors. The data is used to produce aggregated passenger show-up curves for each day and the forecasts are updated weekly to include the latest trends in data. In addition, the boarding card scans are fed in real-time to a dashboard where security supervisors can monitor any deviations from the planned show-up.
Other sources include archway metal detectors and x-ray scanners. Anonymous data can be extracted from the systems and is used for calculating process rates and the number of trays per passenger. These are important parameters when converting the aggregated passenger show-up curve to a staffing plan, which is also displayed in real time in the operational dashboard. As sensors are installed in each lane, the waiting time measurement system knows the actual number of open lanes, so the supervisor has the full overview of the operation and can make well informed decisions if needed.
When following up on the performance, the combination of data sources gives a detailed picture that makes it easy to identify deviations in passenger forecasts, process rates, staffing levels or planning parameters and adjust future plans accordingly.
Detecting dynamic queues in check-in
For check-in and border crossing areas in CPH, the waiting time measurement is more complex than the security check. The check-in area is characterised by multiple, shorter queues that can appear and disappear within a short time span. In addition, the queuing area and tensa barrier setup for each queue is not defined statically as it depends on the airline in question. It may change from day to day or even during check-in depending on the passenger volume and other factors. Finally, the passengers queuing for check-in are mixed with general passenger flows through the terminals. This is also the case for most of the border crossing areas where the queues may extend into the airside retail areas during busy periods.
For these reasons, CPH searched for a technology capable of tracking nearly all passengers with high accuracy when looking to replace the manual counts in 2013. The stereo camera solutions at the time were able to detect passenger counts and dwell times across pre-defined lines and zones, but as the check-in allocation in CPH is highly flexible and dynamic (as many as six different airlines with different counter and queuing needs may use the same counters throughout the day), such a solution was not sufficient to be able to report on individual airlines check-in performance as part of the Service Level Agreement (SLA) between CPH and airlines.
Working closely with the selected provider, Xovis, a more advanced algorithm was developed and CPH was one of the first airports in the world to install a sensor system that can dynamically detect the formation, shape and development of individual check-in queues without prior knowledge. Combining the measurements with the realised check-in allocation provides the full overview of open counters, process times, waiting times, queue lengths and KPIs for each airline separately. The setup was first trialled successfully in Terminal 2 and by 2015 all check-in areas and border crossing areas were covered.
Using sensor data to improve operational efficiency
The data collected by the waiting time sensors is a key factor in the ongoing work to improve the passenger experience and efficiency for the entire check-in process.
In the short term SLA performance is monitored and reported on a weekly basis and recurring performance issues can be identified. Working closely with airlines and ground handlers, CPH can adjust the location of check-in and suggest changes to the number of open counters, the opening hours and the choice of tensa barrier setup, all based on a solid data foundation. Often the passenger experience can be improved without increasing the total workload for the handlers. The effect of changes is easily verifiable using data from the sensor system.
In the medium term, CPH actively encourages airlines to embrace self-service initiatives such as online check-in, self-service kiosks and self-service bag drops. The airport has a long tradition with self-service kiosks but even today there are large differences between airlines in terms of self-service maturity. By using data from the sensor system, CPH can provide strong cases built on historical experience from other airlines or even operational tests. Currently the number of self-service bag drops is growing in line with new airlines joining the setup for the mutual benefit of airlines, ground handlers, CPH and – most importantly – the passengers.
Another example of the use of sensor data for process improvements is the formation of a common-use, all-day check-in with three network carriers that used to have dedicated check-in. The three airlines were identified as good candidates for a common use setup as their departures were evenly distributed throughout the day; they belonged to the same alliance; had the same ground handler; and their check-in systems were similar. Before the discussions with airlines and handlers took place, CPH prepared detailed material on the current passenger show-up profiles, processing times, queue lengths, waiting times and counter opening patterns for each airline. Furthermore, the same data was used to simulate the effect of a common use setup demonstrating how a more efficient use of the counters would result in shorter queues and fewer open counters in peak times, while still maintaining the service level targets. Ultimately this convinced the airlines of the potential of a common-use setup.
Finally, in the long term, the sensor data is used as the base input for the CPH capacity planning model (Beontra B Capacity module) to calculate the demand for check-in counters, border crossing lanes, queuing areas etc. for the next five to 10 years. The output of these calculations is used by the master planning department as an important input for the CPH investment programme.
This article has described how Copenhagen Airport has deployed sensor technology and used the collected data to improve the operational efficiency in both the central passenger security check and the check-in areas. Although data and new models and procedures for planning and follow-up have played important roles, the changes would not have been successfully implemented without the close collaboration with both internal and external stakeholders, as well as a close partnership with the system suppliers. Sensor technologies for passenger flow measurements are becoming increasingly more popular with airports, however, installing the sensor system and measuring waiting times is only a first step. Using the data in combination with other sources to improve forecast, planning, operational and follow-up procedures is where the full value of these systems will be found.
Biography
Esben Kolind is Head of Operational and Business Analysis at Copenhagen Airports. He holds a Master’s degree in Applied Mathematics from the Technical University of Denmark, where he focused on operations research. Since joining Copenhagen Airports in 2010, he has worked on numerous projects optimising the airport’s operation, including Wi-Fi tracking of passengers, sensor-based queue detection, common-use check-in and self-service bag drop, check-in counter allocation, passenger forecasting and long-term demand forecasting for the airport masterplan.
Issue
Related topics
Airside operations, New technologies, Passenger experience and seamless travel, Sensory technology


 Chief Executive Officer
 CEO
CEO Chief Operating Officer
 Head of Operations, Safety and Emergency
 Chief Strategy Development Officer
 Head of Operations
 Airport General Manager
 CEO
CEO Chief Executive Officer