

Airport Big Data: Reality or hype?
- Like
- Digg
- Del
- Tumblr
- VKontakte
- Buffer
- Love This
- Odnoklassniki
- Meneame
- Blogger
- Amazon
- Yahoo Mail
- Gmail
- AOL
- Newsvine
- HackerNews
- Evernote
- MySpace
- Mail.ru
- Viadeo
- Line
- Comments
- Yummly
- SMS
- Viber
- Telegram
- Subscribe
- Skype
- Facebook Messenger
- Kakao
- LiveJournal
- Yammer
- Edgar
- Fintel
- Mix
- Instapaper
- Copy Link
Posted: 14 October 2014 | Dr Roland Kreig, Fraport AG Frankfurt Airport Services Worldwide
Dr Roland Krieg, Senior Executive Vice President of IT at Fraport AG Frankfurt Airport Services Worldwide, asks whether Big Data exists at airports and how we can use it to improve the passenger experience and business performance.

Big Data is often used as a blanket term referring to the collection of data sets so large and complex that it becomes difficult to process them using traditional database management tools or data processing applications. In the airport world, the amount of data is actually not as big as in other industries, but the complexity is enormous – especially for major hub airports including Frankfurt Airport (FRA). Furthermore, the intelligent usage and analysis of data to improve business is the goal and, thus, Big Data is often a synonym for special types of Business Intelligence.
Does Big Data exist at airports?
Let’s take a look at the journey of local passengers at airports. The passenger uses ground transportation to get to the airport and perhaps parking facilities. After checking in the passenger’s baggage is serviced by ground handling staff and the airport provides passenger guidance. The passenger will pass several control and security check points and will finally be ‘airside’, where they become a shopping and services customer.
All these processes generate data, especially at an airport like Frankfurt, where the operator Fraport offers a wide range of services such as airside and terminal management, ground handling, security, facility and real estate management – as part of the its ‘integrated business model’. Thus, Fraport generates a lot of data through its various activities conducted on a regular basis at the FRA hub.
These different processes generate very inhomogeneous views:
- General data like weather, punctuality information from ATM
- Data related to aircraft movements (e.g. time stamps, load and performance data)
- Data related to passengers – ‘average’ figures only and not related to individuals
- Data related to individual but ‘anonymous’ passengers.
Furthermore, one has to distinguish between predictions, real-time usable, and statistical only data. Thus, the amount of data might be small compared to those of a retail chain, but the complexity is high. Overall, Big Data does represent a challenge for airports.
How does Fraport manage this complexity and improve the passenger experience at Frankfurt Airport?
The following examples show realisations of the four different views on Big Data described above.
Aircraft noise emissions
Regarding the exposure of airport neighbourhoods to aircraft-related noise, the sharing between the different runway operational-directions (East to West, called 25 or West to East, called 07) is of major importance, because different runway operating modes affect different neighbours. FRA has collected these statistical data for decades and publishes the noise distribution data to stakeholders on a daily, monthly and annual basis via the internet. Figure 1 shows an example of the number of aircraft arrivals in May 2014 for both runway operational directions.
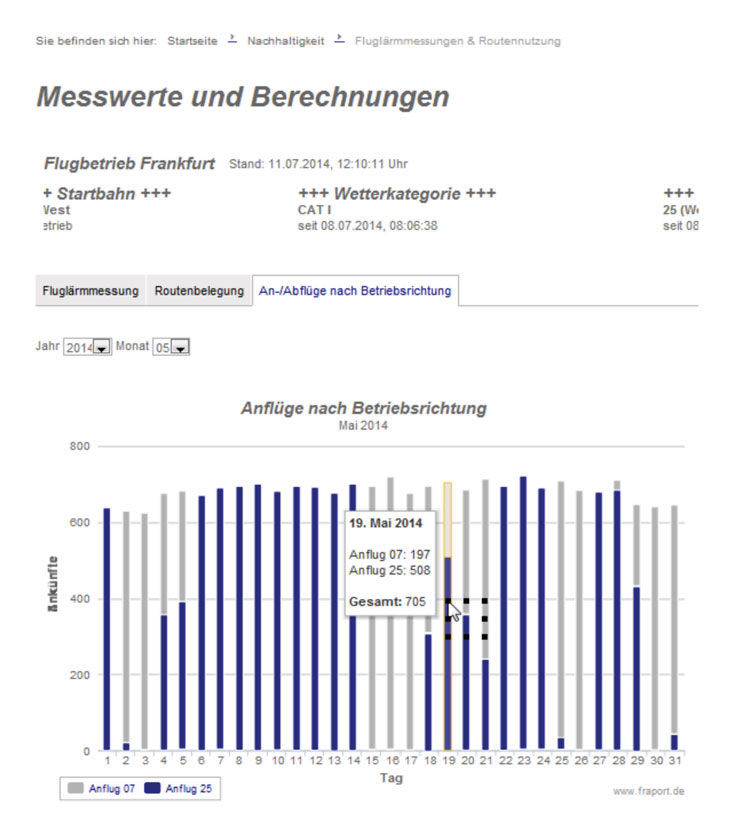
Figure 1: Sustainability homepage of Fraport, showing the daily share of operational directions (Approach/Anflug 07 vs. Departure/Anflug 25)
Enhancing airside operations
To optimise airside operations – whereby Fraport plays a significant role as apron controller at FRA – a variety of ‘near real time’ systems are in use. Punctuality, utilisation of positions, forecast of movements, and all other relevant data are available in the Business Intelligence System and presented in tables and plots. Specialists can correlate this data with data from other sources, such as weather or ATM information to analyse specific interdependencies. The Airport Duty Manager uses an Intelligent Airport Map (see Figure 6) showing the ‘live position’ of the aircraft, enriched with context on the background of the airport layout. Aircraft-related information for planes at the gate or on the apron, as well as A-CDM time stamps are visible from tool-tips by simply clicking at the plane symbol. Empty red positions mark delayed incoming flights. Delayed outbound flights would be symbolised by a red aircraft icon. One could say that the map is the background for a representation of data from Fraport’s Business Intelligence System.
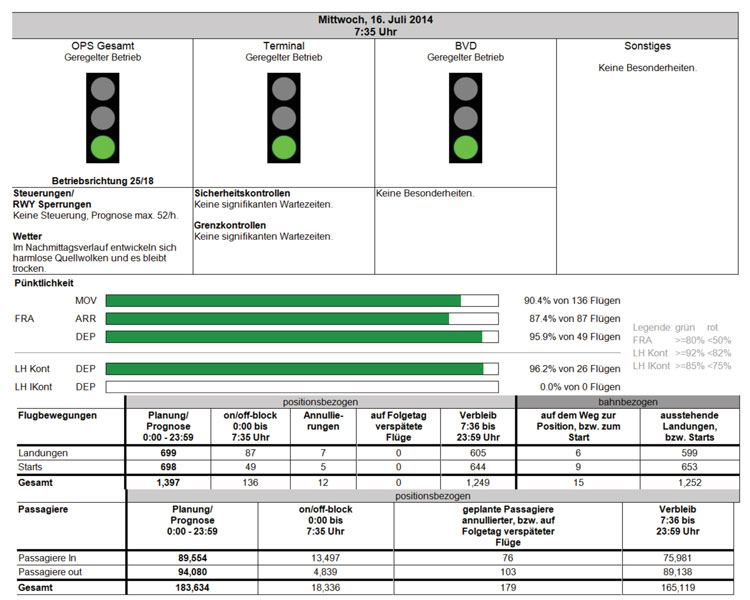
Figure 2: ‘Management cockpit’ showing traffic light symbols for airside, terminal and ground handling operations, punctuality bar diagrams and actual forecast tables
On the other hand, the system also generates a ‘management cockpit’ display, which provides top management with regular situational awareness (Figure 2).
Reducing waiting times
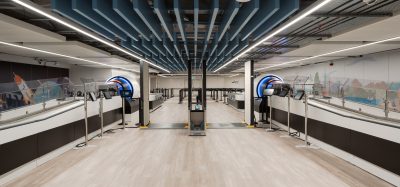
Minimal queuing times at airport security checks are a critical factor for passenger satisfaction. Fraport measures these times with different technologies. The first generation was based on the detection of Bluetooth signals from smartphones, providing data on the length of time a passenger spent in the queue and going through the screening process. Nowadays, to get more actual data we use intelligent video to measure the number of passengers in the queue and the number of passengers screened per minute. This leads to an expected waiting time.
But even this data is much too late for reacting in the case of rapidly growing line-ups. Airport- and security-responsible agencies need to know the forecast for the hours ahead, so that they can balance staffing with the number of open security lines in different parts of the terminals – as well as the forecast for the next few days to scale staffing on duty. Achieving this Big Data analysis helps a lot. Because airports typically receive the passenger data (with flight destination and transfer information) too late for a sufficiently precise forecast, they have to develop their own predictions.
Fraport uses advanced Business Intelligence methods to analyse historical data of all passengers over the last few years; representing hundreds of millions of data pieces. As a result, the average number of passengers travelling from or to FRA can be predicted for every specific day: taking into account not only the season, but also upcoming holidays and trade fairs (which impact passenger traffic volumes as well). Knowing this, the passengers are ‘attached’ to the real flights with actual gates, positions and flight times.
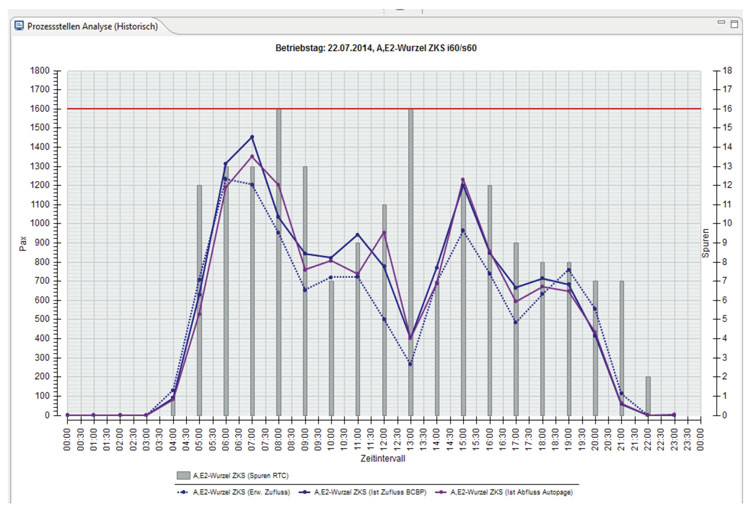
Figure 3: ‘Hours ahead’ prognosis (dotted line) and the real number of passengers entering the security check at Pier A of Terminal 1, measured with two different electronic methods (full lines) showing good accordance
In the next step, an agent-based simulation of passenger movements through the terminals includes possible bottlenecks, such as security checks or border control (passport) lanes, and is executed every few minutes. This creates a reliable prediction of passenger flows to critical bottlenecks. Based on these forecasts, advance planning of staffing requirements can be done to minimise passenger waiting times (Figure 3).
Understanding shopping trends
Of equal interest to the above is passengers’ shopping behaviour, as the customers of the airport’s stores. Airport retail managers look at the preferences of the passengers in different perspectives, including which product groups have the highest sales for particular nationalities (or markets), the shop performance in different terminal areas, and whether the shop mix and goods being offered are optimal for the passengers using that area of the terminal. To get a complete picture, the Business Intelligence System combines traffic data and retail sales information from the shops, which includes the relevant flight number. The best way to analyse such data is to use Visual Analytics, which brings up the data in so-called Heat Maps or in a geo-referenced presentation (Figure 4); this helps the analyst to understand complex circumstances using an interactive visual interface. With this interface, Big Data methods are ideal for ad-hoc-analysis of huge and complex retail data.
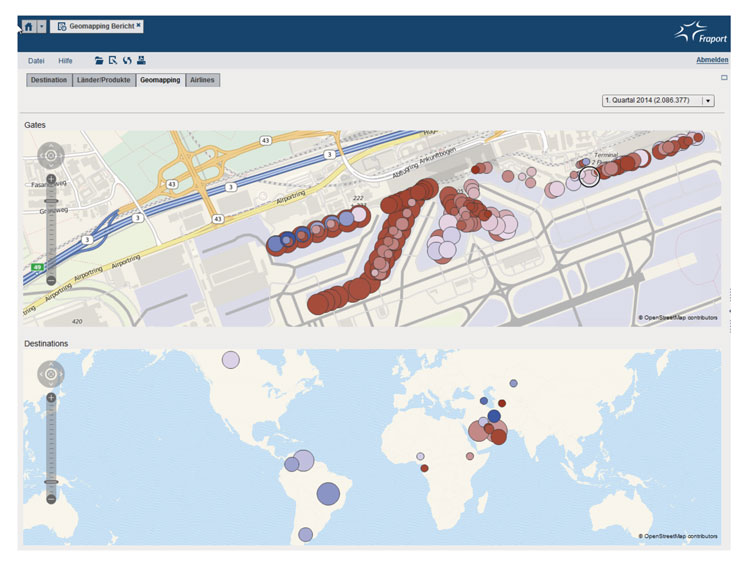
Figure 4: Prototype Geo-mapping report of retail revenues (represented by bubble size) related to the departure gate and flight destination (above) and to the destination for a defined gate area (below)
What is the right architecture to get the best of the data? How does Fraport manage this challenge?
To collect, store, correlate and analyse data from all the different systems properly and efficiently, it is necessary to follow a few architectural principals:
- Whenever you use business intelligence, use it based on one central data warehouse. One should avoid analysing data in different operational systems. This is the only way to get consistent results the management can rely on
- Business intelligence for non-operational systems could be done on a different IT basis, but then the relevant financial, administrative and commercial data must also be duplicated to the central data warehouse
- Develop a clear staging process between the operational systems and the data warehouse. For example, this helps by consolidating data from and standardising reference data across multiple source systems. Airports should not underestimate the effort required for the staging process
- Base your analysis on a stable and detailed process model. This is important for the right conclusions
- Use the opportunity to combine data from different processes to get a ‘bigger picture’ of your business.
Using these fundamental principles, Fraport has developed the IT architecture shown in Figure 5 to manage Big Data at Frankfurt Airport.
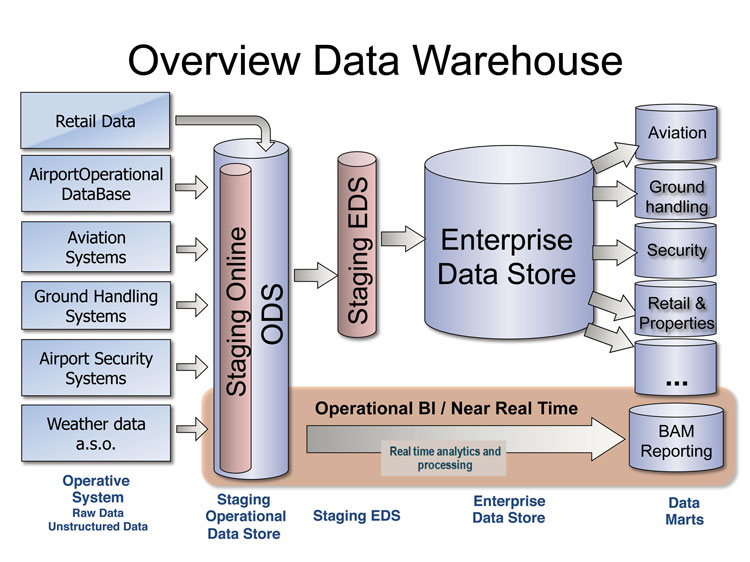
Figure 5: Fraport’s IT architecture to manage Big Data at Frankfurt Airport
In conclusion, let’s go back to the question posed in the title: Airport Big Data: Reality or hype? Indeed, Big Data is supporting Fraport to inform its customers and stakeholders, to improve operations (specific and overall), to enhance retail activities in the terminals and to increase overall passenger satisfaction at FRA.
This article has outlined the experience and method taken by Fraport. Other large- and even medium- and smaller-sized airports are generating increasing amounts of data, too. This is partly being driven by the intensified digitisation of our mobile society in general, by the implementation of airport-specific and industry-wide IT systems worldwide. In order to handle increasing traffic volumes and the increasing needs and expectations of customers (both B2B and B2C) as well as other airport stakeholders these exponentially growing Big Data volumes need to be optimally managed, presented in understandable and useable ways, and leveraged to meet business and customer service and experience goals.
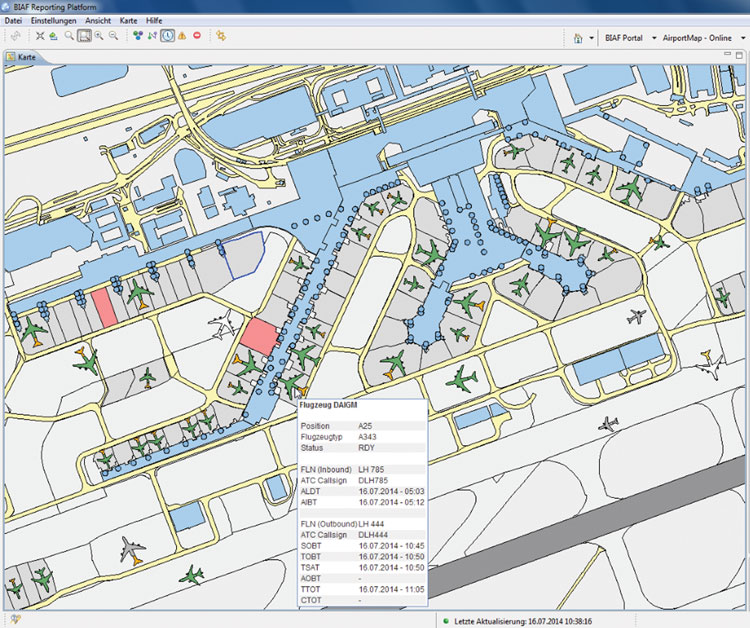
Figure 6: The Intelligent Airport Map shows the ‘live position’ of the aircraft
Biography
 Dr Roland Krieg has been Senior Vice President of IT, acting as CIO, of Fraport AG for over 10 years. He has previously been a member of the Supervisory Board of Fraport AG and of four subsidiaries of Fraport AG, and is also a member of the ACI Worldwide IT Standing Committee. Dr Krieg originally studied physics and graduated as a Dr. rer. nat from the University of Darmstadt. He then spent nine years with an engineering contractor as the Manager for Thermodynamical Plant Simulation, and later as Head of IT. He then spent two years with IBM before joining Fraport AG in 1997.


 Chief Executive Officer
 CEO
CEO Chief Operating Officer
 Head of Operations, Safety and Emergency
 Chief Strategy Development Officer
 Head of Operations
 Airport General Manager
 CEO
CEO Chief Executive Officer