




Denise Pronk, Head of Sustainability and Sara Solis, Circular Economy Lead at Royal Schiphol Group explore how Schiphol’s latest waste assessment uncovered hidden environmental impacts and challenged assumptions about what matters most in airport sustainability.
Airports are already used to measuring CO2. It is one of the clearest and most mature ways to track climate performance, and it helps sustainability teams compare progress over time. But materials and waste can still sit quietly in the background, even though they are part of the airport’s wider Scope 3 footprint. At Schiphol, we wanted to test what happens when we look more closely at what leaves the airport as waste. Would the biggest streams by weight also be the biggest climate and environmental hotspots? The short answer: not always, and the most important signals came from just a few bins.
Why we went looking
Most airports know how much waste they produce and where it goes, because contracts and reporting demand it. What that rarely tells you is which streams matter environmentally. This connects directly to how our circular economy strategy has evolved: we moved away from an earlier “zero-waste airport” ambition - under 1% residual waste - because it wasn’t a useful steering metric and made CO2 reduction our overarching indicator instead. That’s still the right call: CO2 is the sector’s most mature metric and plugs straight into the ACI Airport Carbon Accreditation (ACA). But a CO2-only view can miss things, such as nature-related impacts from food waste. So, as part of the environmental assessment under TULIPS, the EU Horizon 2020 programme where Schiphol is a lighthouse airport, we tested our waste portfolio through a second lens.
Who did what?
We commissioned Hedgehog, an Amsterdam-based Life Cycle Assessment consultancy, to run the environmental impact and eco-cost numbers. The modelling and figures are theirs; the operational interpretation is ours. This split matters, because this kind of assessment is still new for airports, and rigour on the numbers is as important as usefulness in the conclusions.
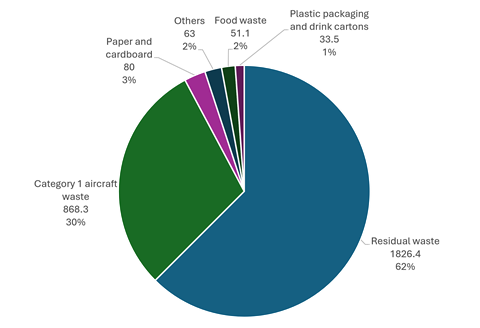
Figure 1: Distribution of residual streams by weight at Amsterdam Airport Schiphol in 2024, total 12,420 tonnes

The method, without the jargon
Schiphol handed over 44 waste streams from 2024, which Hedgehog grouped into 25 workable categories, each assigned a treatment route (landfill, incineration or recycling) based on waste-handler data. This was a treatment-phase LCA, following ISO 14040/14044, modelled in SimaPro with Ecoinvent data and the Environmental Footprint 3.1 method across 16 impact categories, rolled up into four themes for readability:
- · Climate change - the familiar CO2-equivalent warming footprint.
- · Human toxicity - pollutant exposure risks to people, often linked to incineration and hazardous handling.
- · Protecting nature - ecosystem pressure: land use, eutrophication, acidification - where food waste punches above its weight.
- · Resource scarcity - depletion of scarce raw materials, relevant for metals and electronics.
Hedgehog also calculated eco-cost using the Eco-costs 2025 method - environmental pressure translated into one monetary figure. Worth saying plainly: it’s not an invoice, a tax or a liability, just a prioritisation ruler. And it only covers the treatment phase, not the upstream footprint of making the product in the first place.
What the numbers said
Total treatment-phase climate impact came to 2,922.3 t CO2-eq. Residual waste alone was 62% (1,826.4 t CO2-eq), Category 1 aircraft waste another 30% (868.3 t CO2-eq) - together over 90%.
Figure 2: Distribution of the top five residual streams by Climate Change at Amsterdam Airport Schiphol in 2024, total 2,922.3 t CO2-eq
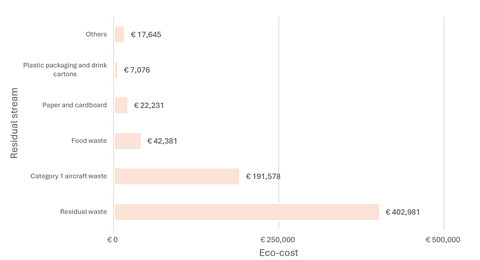
Eco-cost told the same story: €683,891 in total, led by Climate Change (€438,344, 64%) and Protecting Nature (€168,551, 25%), with Human Toxicity at €60,944 (9%) and Resource Scarcity accounting for a much smaller share. By stream, residual waste and Category 1 waste made up 87% of eco-cost between them.
Figure 3: Distribution of residual stream eco-costs by category at Amsterdam Airport Schiphol in 2024, total €683,891
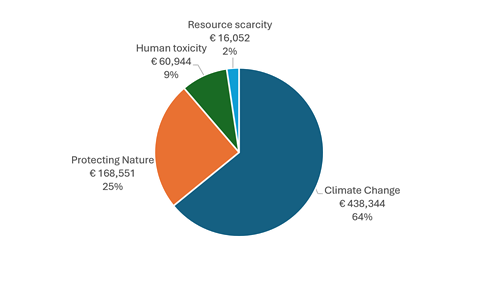
Figure 4: Distribution of the eco-cost by residual streams at Amsterdam Airport Schiphol in 2024, total €683,891
What it means on the ground
Residual waste is the clearest diagnostic signal. When volumes are high, it often points to recyclables leaking into the wrong bin, contamination, or infrastructure that does not make separation easy enough. This is where airports can act directly: better bin placement, clearer separation, supplier engagement and operational checks.
If you don’t yet have a CO2 framework you use systematically, this is a nudge to build one”
Category 1 aircraft waste is different. It is regulated and has genuinely limited treatment options, so the answer is not simply better signage. Progress will depend more on minimisation, airline and caterer collaboration, and sector-level conversations about what regulation currently allows.
Food waste is the plot twist. It is modest from a CO2 perspective, but much more visible when looking at nature-related impacts. That is exactly the kind of blind spot a carbon-only view can create.
Two rulers, one rubbish bin
Here’s the twist worth flagging honestly: Schiphol already measures the end-of-life CO2 of its residual streams, and has done for a while, using our own CO2 framework to monitor, prioritise and steer our circular economy strategy. That framework uses different assumptions, different treatment-route logic and a different database vintage than Hedgehog’s assessment. The result: our totals and Hedgehog’s totals are not directly comparable - a tidy demonstration that methodology and database choices define the scope of what you measure, not just the topic.
The reassuring part: qualitatively, the two agree. Our own CO2 framework flags the same priority streams - residual waste and Category 1 aircraft waste on top - even though the absolute tonnes differ. What Hedgehog’s approach adds is completeness: a fuller environmental picture beyond CO2 alone.
We’re keeping our current CO2 framework as the day-to-day steering tool, with an update planned for 2027 - not sooner, because switching methodology too often destroys year-on-year comparability, and right now the wider field of environmental databases and methods is still visibly moving. That volatility is precisely why we wouldn’t make broader assessments like Hedgehog’s a systematic monthly metric today. But it’s healthy to check in periodically with a different lens, both to sense-check whether our current priorities still hold, and to keep an eye on whether the methodology is maturing enough to justify a bigger shift later. For now, treat it as a sense check, not a replacement.
For other airports
If you don’t yet have a CO2 framework you use systematically, this is a nudge to build one - it steers your streams and feeds directly into ACA and other regulatory reporting. If you have one but haven’t refreshed it recently, it may be time - just go in with eyes open, since changes to treatment assumptions, databases or scope can make the new framework incomparable with the old. And if you want a more rounded view of environmental performance right now, a broader impact assessment across categories like these can reveal whether your priorities are right, or where your sustainability strategy - particularly on resources - needs fine-tuning. Longer term, as methodologies and databases standardise further, this style of assessment could well become a mainstream way of measuring environmental impact, not just an occasional check.
For the sector and policymakers
The bigger opportunity is comparability. Airports report waste differently enough that peer learning is harder than it should be. A shared vocabulary for residual waste, cabin waste, food waste and other recurring streams would let the sector compare hotspots without forcing identical operations on everyone. Strengthening the link between waste data and Scope 3/ACA reporting builds on systems airports already have. And Category 1 aircraft waste is a reminder that some barriers sit in regulation, not operations - worth a coordinated push through airport networks rather than each airport quietly hitting the same wall alone.
The takeaway
Not every airport’s rubbish will look like ours. But the principle travels: don’t treat every waste stream as equally important, and don’t assume one ruler tells the whole story. Look before you sort - and every so often, measure twice.












No comments yet