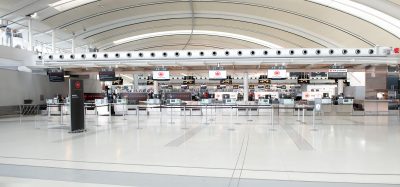
E-gates at Zurich Airport
- Like
- Digg
- Del
- Tumblr
- VKontakte
- Buffer
- Love This
- Odnoklassniki
- Meneame
- Blogger
- Amazon
- Yahoo Mail
- Gmail
- AOL
- Newsvine
- HackerNews
- Evernote
- MySpace
- Mail.ru
- Viadeo
- Line
- Comments
- Yummly
- SMS
- Viber
- Telegram
- Subscribe
- Skype
- Facebook Messenger
- Kakao
- LiveJournal
- Yammer
- Edgar
- Fintel
- Mix
- Instapaper
- Copy Link
Posted: 8 December 2011 | Albert Steiner, Robin Breu and Patrick Bruderer, Zurich University of Applied Sciences and Manuel Renold, Simulation Expert at Zurich Airport | No comments yet
The airline industry is facing enormous challenges today and even more so in the future. The continuing increase of passenger and freight transport demand, the competition among airlines and the resulting cost pressure forces airlines to continually adapt and optimise their processes. In addition, the cost of delays for all involved stakeholders can no longer be ignored5.
Regarding the costs and revenues of an airline, the utilisation of its fleet plays a key role, which in turn is determined both by air traffic as well as ground operations. There are many parties involved and the processes that determine the utilisation are interdependent and complex4. When taking a closer look at ground processes, the turn time, i.e. the time period an airplane is on the ground, is of crucial importance for airlines as well as for airports3. For example, a short turn time, allows hub airports to offer shorter minimum connecting times to airlines.
Depending on the customer service policy of an airline, besides efficient processes and short turn times, a specified level in customer satisfaction needs to be achieved. This is, however, quite often at a cost to efficiency. Hence, feasible solutions need to address both aspects.
In this technical article, we present the results of a simulation based assessment of different gate layouts and operational concepts with the goal, to develop improved and feasible solutions for both airports and airlines as well as for passengers. The processes considered in this study cover the entire period from the boarding announcement up to and including the closing of the doors of the airplane. Thereby, the average overall boarding time as well as the average process time of the passengers, were calculated to allow for an assessment from an airline and passenger perspective. A more detailed discussion of the study can be found in Breu and Bruderer1.
One of the main findings was that using a combination of one manual gate and two electronic gates (E-gates) together with a wide queuing area (i.e. a width of 1.8m instead of 1.4m), leads to a significant reduction compared with the current gate setup of both the overall boarding time and the time passengers spend in the system. Therefore, using E-gates can be very beneficial for airport operators.
The system under investigation
In 2007, a test gate for investigating new passenger handling processes and modern gate infrastructure concepts was implemented at Zurich Airport. Based on a new setup with its pre-boarding area, measurements of boardings with two manual gates were carried out and the boarding times were compared with the previously used standard configurations. Besides a pre-boarding area, Zurich Airport was also interested in the potential impact of using E-gates on the efficiency and operational aspects of the boarding process.
To quantify these effects by simulation, we sub-divided the gate system into five main areas as shown in Figure 1. These five zones have been modelled as separate but linked blocks. The separated zones can be described as follows: After the boarding announcement, the passengers will queue up in the queueing area, where the width of this area plays a key role as it influences indirectly the gate capacity. The type and the number of gates are the major elements with respect to the gate capacity and boarding times. The pre-boarding area allows for some buffering of passengers called some time before the official boarding announcement. Once the entrance to the jetway is opened, the passengers walk through the jetway and enter the airplane.
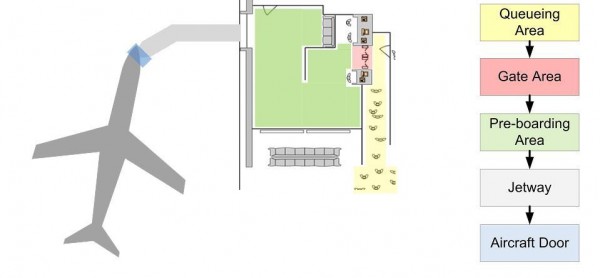

FIGURE 1 The system and its building blocks considered at gate A67 at Zurich Airport. The entire process for a passenger is covered, from waiting in the queuing area (light yellow area) until entering the airplane (light blue area).
Project steps – data collection to practical recommendations
After dividing the system as described in Figure 1, we determined what kind of data was required to capture the dynamics of the system together with some feasible data collection methods. Most data was extracted from video recordings, where 31 boardings were captured, with a total number of approx 2,700 passengers counted. The focus was on the area around the gate. Figure 2a provides a view of this queuing area.
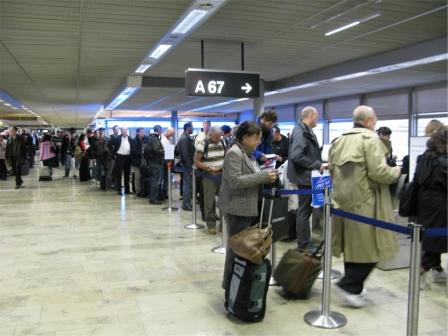

FIGURE 2A Passengers in the queueing area
Two important variables have been extracted from the video recordings. First, the inter-arrival time, that means, the time between two passengers arriving at the queue, and the so-called inter-service time, the time between two passengers served at the gate. Figure 2b shows an example of a video frame. The variables were extracted from a sequence of video frames. Data privacy requirements were guaranteed by the fact that no faces were captured by the video recordings (see Figure 2b).
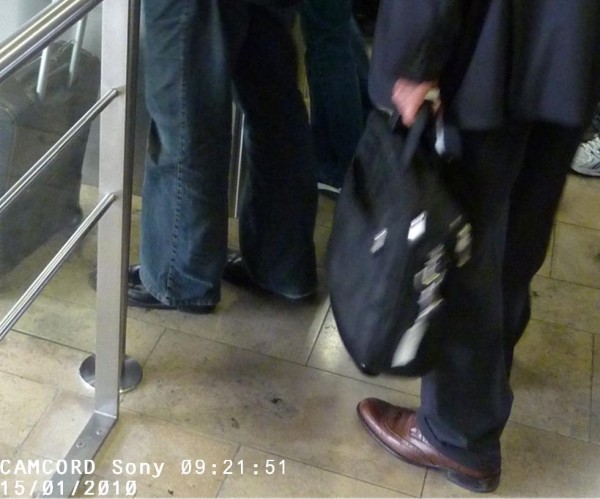

FIGURE 2B Passengers waiting at the gate area
Based on the measurements, the parameters of the model were estimated to allow for a proper calibration of the simulation model. The simulations were carried out using the discrete event simulation software tool ARENA®6. Once the simulation results were analysed and some preliminary findings were discussed, Zurich Airport decided to equip the gate area with one manual gate and two E-gates, gate A67, (see Figures 5a and 5b) and to implement the operational recommendations of the project team. Next, to validate the simulation model, measurements at the new gate set-up were carried out and compared with the predictions made by simulations. Finally, based on the above results, some practical recommendations were defined. For details see the section ‘Conclusion, recommendations and outlook’ and Breu and Bruderer1 respectively.
Scenarios investigated and parameter settings
From the many possible settings a total of 12 scenarios were selected for simulations. The main parameters considered were both the number of manual and electronic gates, the size of the pre-boarding area, and the width of the queuing area. Table 1 provides an overview on the parameters selected for each scenario.
TABLE 1: Parameter setting for the twelve scenarios investigated. Scenarios S01 to S04 represent the current gate layout, with a pre-boarding area of varying size. Alternative scenarios S05 to S08 have one manual and one electronic gate (E-gate), with differences in the size of the pre-boarding area and the width of the queuing area (standard: width of 1.40 meters, wide: width of 1.80 meters). Alternative scenarios S09 to S12 have one manual and two electronic gates, again with different sizes of the pre-boarding area and the width of the queuing area. (*) Setup currently used at gate A67 at Zurich Airport.
Scenario Number | Number of Manual Gates | Number of E-Gates | Size pre-boarding area [Pax] | Width of queuing zone |
| S01 | 2 | 0 | 60 | standard |
| S02 (*) | 2 | 0 | 30 | standard |
| S03 | 2 | 0 | 15 | standard |
| S04 | 2 | 0 | 0 | standard |
| S05 | 1 | 1 | 30 | standard |
| S06 | 1 | 1 | 0 | standard |
| S07 | 1 | 1 | 30 | wide |
| S08 | 1 | 1 | 0 | wide |
| S09 | 1 | 2 | 30 | standard |
| S10 | 1 | 2 | 0 | standard |
| S11 | 1 | 2 | 30 | wide |
| S12 | 1 | 2 | 0 | wide |
For each of the three groups of scenarios (S01 to S4, S05 to S08, and S09 to S12) a specific layout as shown in Figure 3 was considered for the simulations.
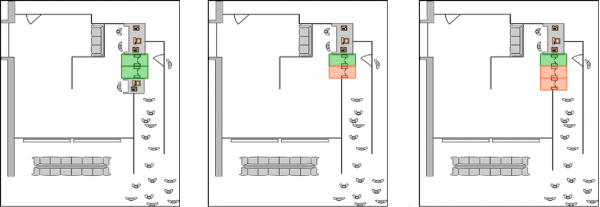

FIGURE 3Three selected layouts: (a) two manual gates (today’s situation) for scenarios S01 to S04, (b) one manual and one electronic gate, for scenarios S05 to S08, (c) one manual gate and two electronic gates, for scenarios S09 to S12. The coloured rectangles show corresponding areas for manual gates (green) and electronic gates (orange). Note: manual gates are always operated by one handling agent.
Simulation results and assessment
For each of the 12 scenarios specified in Table 1, we performed 30 simulation runs, to get a statistically significant number of samples. For each simulation run, the time that each passenger spent in the system was recorded. Based on this information, the overall boarding time as well as the average passenger time in the system was calculated for each scenario. The overall boarding time is defined as the time between the boarding announcement and the closing of doors of the airplane.
Finally, for each scenario, besides the average (mean) we also calculated the standard deviation for the overall boarding time and the time passengers spent in the system. This is important as one seeks not only for short boarding times but also for reliable ones, i.e. with low variability.
Figure 4 depicts the average times for all scenarios together with the corresponding ranges (average ± standard deviation), i.e. the overall average overall boarding times vs. the average time a passenger spends in the system.
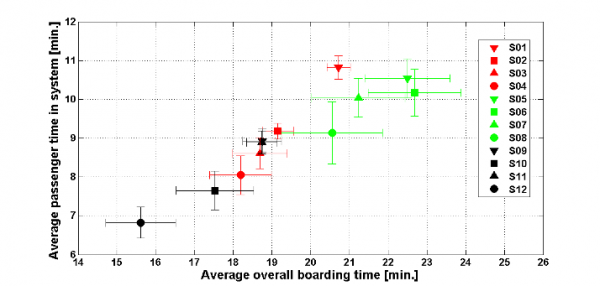

FIGURE 4Simulation results for the twelve scenarios investigated. We see that for scenarios S05 to S08, i.e. those covering the layout with one manual and one electronic gate perform less good than most of the other scenarios. This is mainly because of their limited overall capacity. The best performance was achieved by scenarios S10 and S12, which provide a high capacity at the gates (one manual gate and two electronic gates), but did not use the pre-boarding area.
To get valid assessment results, we performed some statistical hypothesis testing, where we compared the mean of each scenario with the mean of all other scenarios for both temporal measures. It was found that: (i) For the average overall boarding time the mean of the following four scenario combinations was not significantly different: S02 ↔S08; S08 ↔ S09; S08 ↔S11; S09 ↔S11. (ii) For the average passenger time in the system, the mean of the following five scenario-combinations was not significantly different: S01 ↔S07, S01 ↔S08, S03 ↔S09, S03 ↔S11, S09 ↔S11 (also see Figure 4 for a visual comparison).
Based on the statistical tests together with some general comparisons of the average times for the scenarios, we can draw the following conclusions:
- The scenarios with one manual gate and two electronic gates perform significantly better than those with one manual and one electronic gate, which is not too surprising as the overall gate capacity is small for the latter group.
- Scenario S10 and in particular S12 show significantly better performance compared to the other scenarios, both from an airlines/airport and passenger perspective. For scenario S12 the influence of the wider queuing zone becomes particularly obvious, although the width is only 0.4m larger than for the standard case. However, this difference allows passengers to overtake within the queue and thus the overall capacity of the gate layout can be fully used.
- The influence of the pre-boarding area strongly depends on the layout: (a) for scenarios S01 to S04, i.e. with two manual gates, the size of the pre-boarding area has a notably negative effect; (b) for scenarios S05 and S06 (standard queue width) the average times are significantly higher than for S07 and S08 (wide queue width); (c) for scenarios S05 and S07 we observe again a slightly negative effect of the size of the preboarding zone (30 persons), in comparison with S06 and S08 (with pre-boarding being zero); (d) scenario S09 and S11 lead to more or less identical results. Hence, if one manual gate and two electronic gates are used together with a pre-boarding zone with a capacity of 30 passengers, the width of the queuing zone has no significant influence.
- Within each of the three layout groups, the scenarios are independent, with one exception mentioned above (according to item 3d).


FIGURE 5A The gate layout recommended, with two electronic gates and one manual gate. An overview showing the gates together with the queueing zone (foreground) and the pre-boarding area (background)
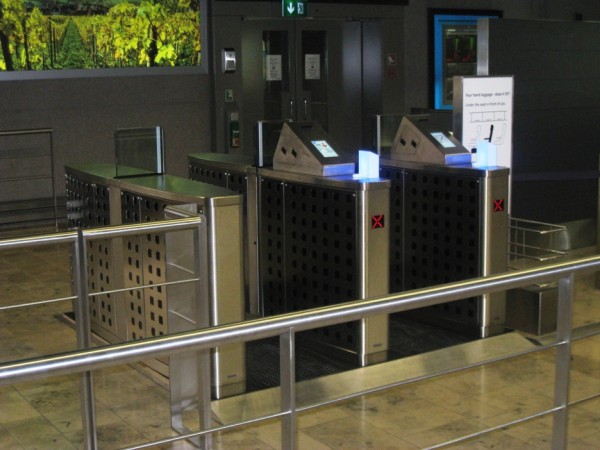

FIGURE 5BA closer look on the two E-gates tested at gate A67, where the boarding card scanner is located on the right of each area
Conclusions, recommendations and outlook
The major findings of this study can be summarised as follows:
- Using one manual gate (operated by one handling agent) and two electronic gates in parallel together with a queue width of 1.8m (instead of only 1.4m) leads to substantially lower values for both measures and at the same time reduces the staff required at the gate compared to the current setup.
- Video data collection together with in-depth data analysis allows for an improved understanding of the processes and therefore a better microscopic simulation model.
- Pre-boarding areas are beneficial for delayed flights only. From the simulations, as in all the other cases the overall boarding times are higher.
- The simulation results with respect to the average overall airplane boarding durations are in very good accordance with earlier findings.
To finally answer the question raised in the title, we can clearly state that using E-gates can indeed be very beneficial for airport operators, if designed and implemented appropriately. Some of the insights gained with this study were considered for planning terminal B at Zurich Airport, which will be re-opened in spring 2012 after a major reconstruction.
Acknowledgements and author contributions
Robin Breu and Patrick Bruderer undertook the research that formed the basis of this paper. Robin Breu, Manuel Renold, Patrick Bruderer and Albert Steiner (corresponding author) collated and wrote the paper. The authors would like to thank Richard Mengel, Project Manager at Zurich Airport from the department of Operations Planning and Terminal Engineering, for his invaluable support with this research project.
About the Authors
Patrick Bruderer, BSc in Aviation, currently Master student at IDP IDP Institute of Data Analysis and Process Design SoE School of Engineering Zurich University of Applied Sciences Rosenstrasse 3, PO Box 8401 Winterthur, Switzerland [email protected]
Robin Breu, BSc in Aviation, currently Master student at IDP IDP Institute of Data Analysis and Process Design SoE School of Engineering ZHAW Zurich University of Applied Sciences Rosenstrasse 3, PO Box 8401 Winterthur, Switzerland email: [email protected]
Albert Steiner, El.-Ing. HTL Thesis supervisor, Senior Research Fellow and corresponding author IDP Institute of Data Analysis and Process Design SoE School of Engineering ZHAW Zurich University of Applied Sciences Rosenstrasse 3, PO Box 8401 Winterthur, Switzerland email: [email protected] web: www.idp.zhaw.ch / www.asteiner.org
Manuel Renold, Dr. phil. nat. Project Leader, Simulation Expert Zurich Airport Operations Planning Capacity (OPC) 8051 Zurich-Airport, Switzerland email: [email protected] web: www.zurich-airport.com


