High Tyre Pressure Test on flexible airfield pavement for new aircraft standard – analysis, conclusion and recommendation
- Like
- Digg
- Del
- Tumblr
- VKontakte
- Buffer
- Love This
- Odnoklassniki
- Meneame
- Blogger
- Amazon
- Yahoo Mail
- Gmail
- AOL
- Newsvine
- HackerNews
- Evernote
- MySpace
- Mail.ru
- Viadeo
- Line
- Comments
- Yummly
- SMS
- Viber
- Telegram
- Subscribe
- Skype
- Facebook Messenger
- Kakao
- LiveJournal
- Yammer
- Edgar
- Fintel
- Mix
- Instapaper
- Copy Link
Posted: 13 December 2010 | Cyril Fabre, Head of Airfield Pavement, ICAOAOSWG/ Pavement Subgroup ICCAIA Representative and Camille Saguès, Airfield Pavement Senior Engineer, AIRBUS S.A.S | No comments yet
Further to the ‘High Tyre Pressure Test’ (HTPT) overview presented in Issue 4 2010 of International Airport Review, this article presents test analysis, conclusions and recommendations. Detailed information on test background, facilities and test procedures are all contained in the former issue; therefore, for a better understanding of this second article and for an overall view of the HTPT test, the reader should refer to Issue 4 2010 of International Airport Review.
Further to the ‘High Tyre Pressure Test’ (HTPT) overview presented in Issue 4 2010 of International Airport Review, this article presents test analysis, conclusions and recommendations. Detailed information on test background, facilities and test procedures are all contained in the former issue; therefore, for a better understanding of this second article and for an overall view of the HTPT test, the reader should refer to Issue 4 2010 of International Airport Review.
This series of tests were part of the decision making process initiated some years ago at ICAO level to resolve the issue of tyre pressure limits currently defined in Annex 14, Volume I, paragraph 2.6.6 (c).
One part of the effort has been to enlist the support of ACI-World to survey its member airports for all reported pavement failures associated with high tyre pressures. The second stage comprised a series of full-scale tyre pressure tests in Toulouse (France) by a team from Airbus and DGAC, and in Atlantic City (USA) by the FAA and Boeing.
Tests and monitoring
Commencing on 22 October 2009, the HTPT test was completed on 8 August 2010, at which date the cumulative traffic of the simulator reached 11,000 passes. However, the simulator tests running on section G (low rutting performance section) were stopped at 10,500 passes on 27 July 2010 when the rut depth of 32 to 45mm endangered the simulator’s manoeuvrability on this test section.
As rutting deformation is the main failure mode with regard to tyre pressure effect, this article focuses only on the main pavement rutting results of the tests.
In addition, the pavement survey includes a comprehensive monitoring of the resilient displacements and strains developed in the pavement by the dynamic loads, based on the pavement instrumentation by LVDT sensors and strain gauges in bituminous and untreated materials, and conducted throughout the entire test campaign.
Thermal conditions of the tests
A pavement temperature survey was performed continuously from test initiation (acquisition period = 15min). The temperature considered in Figure 1 is the mean temperature over the 8cm asphalt concrete (AC) from the top of the section B of the pavement.
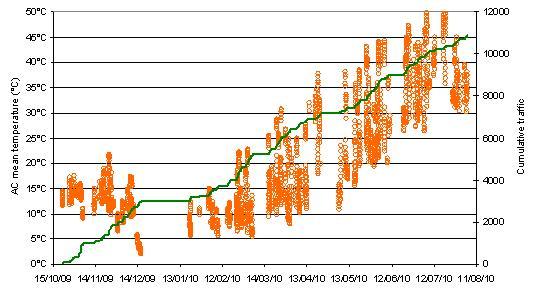

Figure 1 Evolution of the cumulative traffic and the temperature in AC
Bonding condition of wearing course/base AC interface
The quality and durability of the bonding between the different pavement layers highly affect the structural resistance of the pavement.
A comparison of the flexural and contraction strains between the bottom of the surface asphalt concrete, and the top of the base AC layers, clearly reveals a good bonding condition between the two layers, in spite of the very high loads and tyre pressure applied to the pavement.
Rutting deformation measurement and evolution curves
Each rutting survey operation consists of 84 transversal profiles measurements, distributed over the seven structures and four twin-wheel modules (three transversal profiles P1, P2 and P3 for each of the 28 structure-module sets). Figure 2 and Figure 3 show examples of rut depth evolution curves.
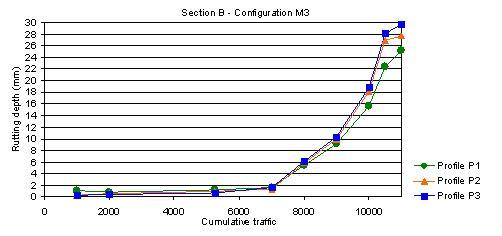

Figure 2 Evolution curve of rutting measured on section B, configuration M3
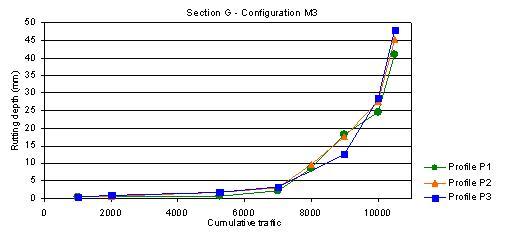

Figure 3 Evolution curve of rutting measured on section G, configuration M3
For all sections (A to G), rutting depth at 7,000 passes (mid-April 2010) remains very low, due to the very moderate AC temperature. The evolution curves clearly exhibit a change in the slope after this date, as a more-and-more significant percentage of the traffic is applied at AC temperatures greater than 30°C.
Figure 4 and Figure 5 show examples of transversal rutting profiles measured by the LRT transverso-profilometer (accuracy is about +/- 1mm).
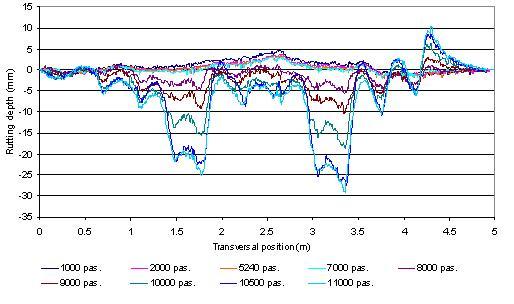

Figure 4 Transversal rutting profiles measured on section B, profile P2, module M3
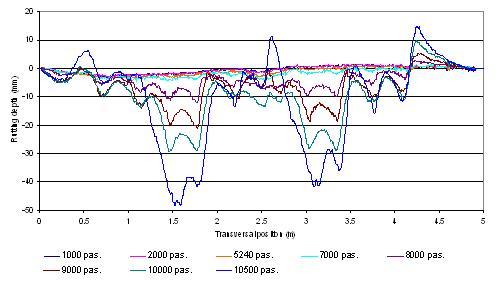

Figure 5 Transversal rutting profiles measured on section G, profile P2, module M3
The negligible permanent upward deformation (upheaval) on the lateral sides of the wheel-path compared to the downward deformation (rutting) – apart from section G which exhibits significant upheaval – suggests that the rutting mechanism is largely due to the post-compaction of the pavement (bituminous and untreated materials) by traffic, and that thermo-visco-plastic creep is very limited.
Figure 6 synthesis presents the maximal rutting depth reached at 11,000 passes on section A to F, for the four configurations. A single curve has been set for sections B and E, as section E duplicates section B.
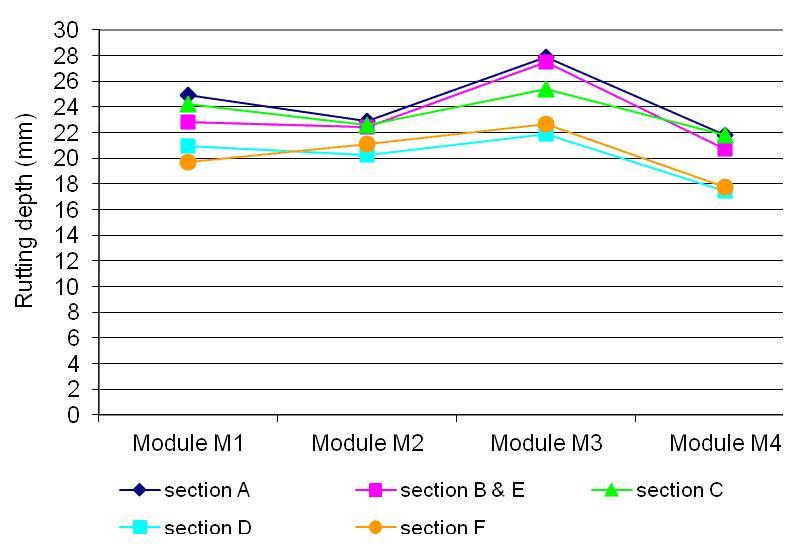

Figure 6 Maximal rutting depth reached at 11,000 passes on section A to section F
For section G (Figure 7), results are presented at 10,000 passes, and at the end of the simulator running (10,500 passes). However, only values at 10,000 passes are considered for the analysis as structural failure of the pavement occurred between these two dates.
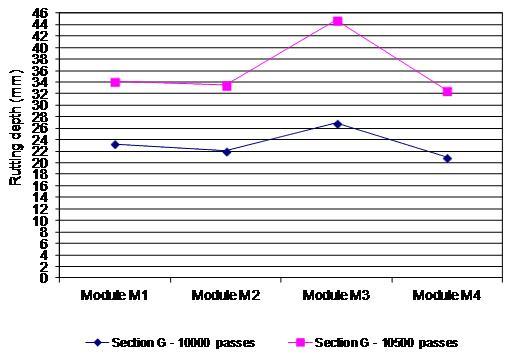

Figure 7 Maximal rutting depth reached at 10,500 and 11,000 passes on section G
Table 1 gives an evaluation of tyre pressure and wheel-load effects towards rutting.
| Module | Module | Module | Module | Pressure effect | Wheel-load effect | |||
| Section | M1 | M2 | M3 | M4 | M3 vs M2 @33.2t | M1 vs M4 @28.7t | M3 vs M1 @1.75MPa | M2 vs M4 @1.5MPa |
| (mm) | (mm) | (mm) | (mm) | (∆ in mm) | (∆ in mm) | (∆ in mm) | (∆ in mm) | |
| A | 24.9 | 22.9 | 27.9 | 21.8 | 5.0 | 3.1 | 3.0 | 1.1 |
| B – E | 22.9 | 22.4 | 27.5 | 20.7 | 5.1 | 2.2 | 4.6 | 1.7 |
| C | 24.2 | 22.6 | 25.4 | 21.8 | 2.8 | 2.4 | 1.2 | 0.8 |
| D | 20.9 | 20.2 | 21.9 | 17.5 | 1.7 | 3.5 | 1.0 | 2.7 |
| F | 19.7 | 21.1 | 22.6 | 17.8 | 1.5 | 1.9 | 2.9 | 3.3 |
G at 10,000 passes | 23.2 | 22.0 | 26.9 | 20.9 | 4.9 | 2.3 | 3.7 | 1.1 |
G at 10,500 passes | 34.1 | 33.5 | 44.7 | 32.5 | 11.2 | 1.6 | 10.6 | 1.0 |
The wheel-load effect on rutting is assessed by comparing modules M1 (28.7t) and M3 (33.3t) both inflated at 1.75MPa, and modules M2 (33.3t) and M4 (28.7t) both inflated at 1.5MPa.
The tyre pressure effect on rutting is assessed by comparing modules M1 (1.75MPa) and M4 (1.5MPa) both loaded at 28.7t per wheel, and modules M2 (1.5MPa) and M3 (1.75MPa) both loaded at 33.3t per wheel.
Tyre pressure effect must be considered with an associated wheel-load, both parameters being closely and intrinsically linked and cannot be described as isolated parameters but contribution of each parameter to rut depth development can be evaluated separately.
Effect of AC rutting performance
For section D (modified AC, high rutting performance), material behaviour with regard to rutting is noticeably better and tends to reduce wheel-load and tyre pressure effects. As expected, rut depth on section G (low rutting performance surface AC) is higher than on other test sections, and visco-plastic creeping at constant volume strain-path is more significant.
Effect of surface treatment
Surprisingly, grooving (section F) appears to improve the rutting behaviour compared to B and E (which shares the same structure) to a similar extent as the modified AC.
Effect of surface AC thickness
Despite the three different thicknesses (6cm, 8cm, and 12cm) of the same standard surface AC used in structures A, B, C and E, their rutting behaviour is quite similar. This may be due to surface rutting being caused by permanent deformation not only of the surface AC but also the AC base course, which are identical in sections A, B, C and E.
Main results drawn from rutting measurement and core samples
Rutting mechanism
Development of permanent deformations increased with high AC temperatures. The tests confirmed that the speed of the rutting evolution significantly increased as the AC temperature exceeds the range 30-35°C, irrespective of the load and tyre pressure configuration.
In addition, core samples show that the permanent deformation not only affects the surface AC layer as anticipated, but also the whole thickness of the surface and base AC. The permanent deformation of unbounded material is the consequence of the very low moving speed of the load.
Wheel-load effect
At 1.75MPa inflation pressure, the weight increase from 28.7t to 33.3t leads to a growth in rutting between +1mm and +4.6mm.
At 1.5MPa inflation pressure, the weight increase from 28.7t to 33.3t leads to a growth in rutting between +0.8mm and +3.3mm.
As a result, the impact of wheel-load on rutting depth remains relatively moderate. This contradicts the current method (soil and bituminous material fatigue low) of permanent deformation evaluation which would give much greater differences in rutting.
Tyre pressure effect
At a wheel-load of 33.2t, the tyre pressure increase from 1.5 to 1.75 MPa leads to a growth in rutting between +1.5mm and +5.1mm.
At a wheel-load of 28.7t, the tyre pressure increase from 1.5 to 1.75 MPa leads to a growth in rutting between +1.9mm and +3.5mm.
Similarly to weight effect, the impact of tyre pressure on rutting can be considered as insignificant.
Conclusions
The primary objective of this full-scale test campaign was to demonstrate whether the new proposed tyre pressure upper limit (1.75MPa) for Code X is reasonable for typical pavements. This objective was successfully achieved and the experiment allowed additional lessons which could be of interest for further investigation on this topic. The test results and analysis lead to the following conclusions:
On wheel-load and tyre pressure effect
For a given wheel-load applied on pavement at a very low speed, the full-scale test campaign showed that rut depth differences ranged from 1.5mm to 5.1, showing that the contribution of the tyre pressure (i.e. isolated from wheel-load effect) to rutting can be considered as insignificant. Wheel-load effect was identified as insignificant on surface and base AC, but more confined in unbounded material, therefore more related to the structural behaviour of airfield pavement which is already known and considered in the ACN or the pavement thickness design method as well.
On rutting mechanism
Rutting initiation is more related to mean AC temperature than traffic level or load parameters. Indeed, the rutting appeared at the same time on all considered wheel-loads or tyre pressures, and rut depth variation increased simultaneously with temperature independently of tyre pressure. The prevailing rutting mechanism is the post-compaction of the pavement material by traffic on both surface and base AC. The visco-thermoplastic creeping of AC material is secondary to the post compaction with the exception of the low rutting performance AC material which combines both failure modes on the same proportions. The core drilling performed after test completion showed that approximately half of the total rut depth is found on the unbounded materials. This unbounded material rutting is more sensitive to the higher wheelloads confirming the prevailing wheel load effect on the deepest layers and therefore the relative low tyre pressure effect on AC material.
On surface AC thickness effect
The test results showed no evidence of AC thickness having any effect on rutting. Therefore surface AC thickness does not appear to be a factor sensitive to tyre pressure.
On AC surface treatment (grooving)
The rut depth on the grooved section appeared to perform better than similar test sections without grooves and its performance similar to that of the modified bitumen section. This unexpected result merits further investigation.
On AC performance with regard to rutting behaviour
The three different AC material specifications gave expected results. The modified AC performed better compared to the weakest AC material (sensitive to rutting). Post compaction is the prevailing rutting mode for modified and standard AC material whereas visco-thermoplastic creeping deformation has a more significant role in the weakest test sections designed to have very high sensitivity to rutting.
Recommendations
In light of the High Tyre Pressure Test campaign, it has been established and substantiated that an increase of tyre pressure from the current X category limit of 1.5MPa to an upper limit of 1.75MPa will not adversely affect either surface and base AC materials or the structural capacity of typical airfield pavement (i.e. pavement life duration will not be decreased as a consequence of increasing tyre pressure). Therefore, such change (supported by both full-scale tests and the ACI worldwide Airport survey) could be ratified without putting aircraft or pavement at risk and would allow for the ICAO tyre pressure limit codes to be formally and permanently changed to be more consistent with both the performance of real world pavement and the new aircraft generation.
About the Authors
Cyril Fabre
Cyril Fabre has worked with Airbus since 1997. He started on A340-300 and A340-500/-600 programmes, especially dedicated on the Winglet design (A340-300, aero-elasticity) and landing gear configuration (A340-600). In 1999 he was integrated into the A380 programme (formerly the Large Aircraft division) in the Infrastructure and Environment Department. He was appointed Head of A380 Pavement experimental programme (A380 P.E.P) to validate the landing gear concept of the heaviest civil aircraft ever built. In March 2006, he was appointed Pavement Manager for all Airbus products, including new programmes (A350, A330-200F, A400M…). Since May 2007, he has been Head of Airfield Pavement in the Engineering Aircraft Architecture & Integration team. Cyril Fabre has a university post-graduate technical degree in Aeronautics and space techniques. He is the aircraft manufacturer representative (ICCAIA) at the ICAO Aerodrome and operations WG Pavement subgroup (AoSWG-PSG). He is also a member of the FAA Standard team.
Camille Saguès
Camille Saguès obtained her engineering degree in 2009 from the ENAC (National School of Civil Aviation), Toulouse, France. She also holds an MSc in Airport Planning and Management from Cranfield University, Cranfield, UK, where she graduated in 2009. She joined Airbus in October 2009 as Airfield Pavement Engineer in the Airport Operations department, and took various responsibilities in the HTPT management, particularly during the operational phase and test analysis.
Issue
Related organisations
AIRBUS S.A.S, International Civil Aviation Organization (ICAO)


